


Page 39 - 2010 (3) Agricultural Census 2010, Punjab Report
P. 39
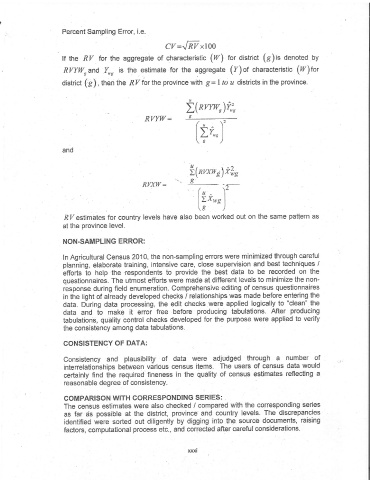
Percent Sampling  Error, i.e.

                                                        CV:Jw xloo

                      tf the RV for the aggregate of characteristic (W) for district (g) i. denoted by
                      RVYII/rand Y,u, is the estimate for the aggregate (f)of characteristic  (W)tor
                      district (g), tn"n ti'te RV for the province  with g: I to u districts in the province.


                                                               ilnvvw,)ri,
                                                 RVYW:         c


                                                                  [?t")'
                      and


                                                                U /       \   ^a
                                                                ZlnrxwE)x("s
                                                                o'
                                                                o
                                                RVXW  =            /       i2-
                                                                   lu  ^
                                                                 'tsv      I I
                                                                    /,"\yg
                                                                   |       I
                                                                   to      I
                                                                   \o      ,/
                      ft Z estlmates  for country levels have also been worked out on the same pattern as
                      at the province level.

                      NON.SAMPLING ERROR:

                      ln Agricultural  Census 2010, the non-sampling errors were minimized through careful
                      planning,  elaborate  training, intensive  care, close supervision  and best techniques /
                      efforts to help the  -respondents   to provide the best data to be recorded on the
                      questionnaires.  The utmost efforts were made at different  levels to minimize the non-
                      response during fleld enumeration.  Comprehensive  editing of census  questionnaires
                      in the light of already  developed  checks / relationships was made before entering the
                      data. During data processing,  the edit checks  were applied logically  to "clean"  the
                      data and to make it error free before producing tabulations. After producing
                      tabulations,  quality control checks developed  for the purpose were applied to verify
                      the consistency  among data tabulations.

                      CONSISTENCY  OF DATA:

                      Consistency  and plausibility of data were adjudged through a number of
                      interrelationships  between virious census items. The users of census  data would
                      certainly find the required:fineness  in the quality of census estimates reflecting a
                      reasonable degree of consistency.


                      COMPARISON  WITH CORRESPONDING  SERIES:
                      The census  estimates  were also checked / compared with the corresponding  series
                      as far ds possible  at the district,  province and country levels. The discrepancies
                      identified were sorted out diligently by digging into the source documents, raising
                      factors, computational  process etc., and corrected after careful considerations-

